Another feature (Line graph) has been added.
Currently it supports only simple Line graph. And it looks like following
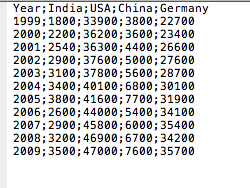
And our .csv file looks like following: (The data is GDP of different countries of years 1999-2009)
Currently it supports only simple Line graph. And it looks like following
And our .csv file looks like following: (The data is GDP of different countries of years 1999-2009)
You can find the code of MIM-Chart Library at the end of THIS POST.


No comments:
Post a Comment