Showing posts with label pie chart. Show all posts

Monday, August 29, 2011

Complete Guide for Pie Chart and Fragmented Pie Chart (MIM Chart Lib)

So our data looks like following and we will make pie chart of the Income column.
Code is in XCode proj > HowToUseFiles> TestClass.m

     [MIMColor InitColors];

    NSString *csvPath = [[[NSBundle mainBundle] resourcePath] stringByAppendingPathComponent:@"myTable.csv"];
    MIMPieChart *pieChartView=[[MIMPieChart alloc]initWithFrame:CGRectMake(40, 40, 600, 500)];
    pieChartView.radius=200;
    pieChartView.tint=BEIGETINT;// Available Tints: GREENTINT,REDTINT,BEIGETINT
    [pieChartView readFromCSV:csvPath  TitleAtColumn:0  DataAtColumn:4];
    [pieChartView drawPieChart];
    [self.view addSubview:pieChartView];


It will make the pie chart look like following, you can change the tint color to see what they look like OR you can GO TO THIS POST to see them. If you tap on a region of pie chart, the respective information label gets highlighted, as in this case Indonesia is highlighted.


Now lets look at fragmented piechart , for now we can give data only through arrays, I need to add support for csv format. But you can use it as following as in XCode proj > HowToUseFiles> TestClassFragmented.m


      [MIMColor InitColors];
    
    _DFragmentedDoughNut *detailedDoughNut=[[_DFragmentedDoughNut alloc]initWithFrame:CGRectMake(0, 0, 600, 600)];
    detailedDoughNut.tint=GREENTINT;// Available Tints: GREENTINT,REDTINT,BEIGETINT
    detailedDoughNut.isShadow=YES;
    [detailedDoughNut setValuesArray:[NSArray arrayWithObjects:@"23",@"45",@"89",@"123",@"21",@"144", nil]];
    [detailedDoughNut setTitleArray:[NSArray arrayWithObjects:@"U.P.",@"Bihar",@"Delhi",@"Punjab",@"Haryana",@"Rajasthan", nil]];
    [detailedDoughNut setOutRadius:200 AndInnerRadius:300];
    [self.view addSubview:detailedDoughNut];
    
Output looks like following


Entire Guide can be found HERE along with downloadables.

Complete Guide for Wall Graph (MIM Chart Lib)

Following is our data and we want to plot Months Vs. Income

Our code residing in XCode Project > HowToUseFiles > WallTestClass.m

      [MIMColor InitFragmentedBarColors];
    
    
    NSString *csvPath = [[[NSBundle mainBundle] resourcePath] stringByAppendingPathComponent:@"myTable1.csv"];
    WallGraph *wallGraph=[[WallGraph alloc]initWithFrame:CGRectMake(50, 40, 600, 400)];
    wallGraph.xIsString=YES;//For Now only xIsString=YES is supported.
    wallGraph.isGradient=YES;
    wallGraph.isShadow=YES;
    wallGraph.style=14;
    wallGraph.needStyleSetter=YES;
    wallGraph.anchorType=NONE;
    [wallGraph readFromCSV:csvPath  TitleAtColumn:0  DataAtColumn:4];
    [wallGraph displayYAxis];
    [wallGraph drawWallGraph];
    [self.view addSubview:wallGraph];
    

So our result looks like following


--------------------------------------------------------------------------------------------------------------------------------------------
The setting as shown in the code below will give result as shown in screenshot just below the code

       wallGraph.isGradient=YES;
    wallGraph.isShadow=NO;
    wallGraph.style=14;
    wallGraph.needStyleSetter=YES;
    wallGraph.anchorType=CIRCLEBORDER;


--------------------------------------------------------------------------------------------------------------------------------------------
Tapping on the Anchor points, will display the corresponding data of the point.

       wallGraph.isGradient=YES;
    wallGraph.isShadow=YES;
    wallGraph.style=14;
    wallGraph.needStyleSetter=YES;
    wallGraph.anchorType=CIRCLEBORDER;


--------------------------------------------------------------------------------------------------------------------------------------------

       wallGraph.isGradient=YES;
    //wallGraph.isShadow=YES;
    //wallGraph.style=14;
    wallGraph.needStyleSetter=YES;
    wallGraph.anchorType=CIRCLEFILLED;


--------------------------------------------------------------------------------------------------------------------------------------------

       wallGraph.isGradient=YES;
    //wallGraph.isShadow=YES;
    //wallGraph.style=14;
    wallGraph.needStyleSetter=YES;
    wallGraph.anchorType=NONE;DE


--------------------------------------------------------------------------------------------------------------------------------------------

       wallGraph.isGradient=YES;
    //wallGraph.isShadow=YES;
    //wallGraph.style=14;
    wallGraph.needStyleSetter=YES;
    wallGraph.anchorType=DEFAULT;


--------------------------------------------------------------------------------------------------------------------------------------------
NOTE: wallGraph.needStyleSetter=NO; For remove the NEXT button on the screen.


Entire Guide can be found HERE along with downloadables.

Complete Guide for Line Chart Chart (MIM Chart Lib)

So our data sheet looks like following screenshot which I want to plot using MIM Chart lib - Line Graph. We want to plot Per Capita Income of India, USA, China, Germany yearwise.


If you don't give which column specifically you want to draw,give value of valueColumnsinRange  as nil , It will plot all the columns on the Line graph.

      [MIMColor InitColors];
    NSString *csvPath = [[[NSBundle mainBundle] resourcePath] stringByAppendingPathComponent:@"myTable2.csv"];

    LineGraph *lineGraph=[[LineGraph alloc]initWithFrame:CGRectMake(50, 40, 600, 400)];
    lineGraph.needStyleSetter=YES;
    lineGraph.xIsString=YES; 
    lineGraph.anchorType=CIRCLEFILLED; //VIEW OTHER anchorType
    [lineGraph readFromCSV:csvPath valueColumnsinRange:nil]; 
    [lineGraph displayYAxis];
    [lineGraph displayXAxisWithStyle:3]; //VIEW OTHER styles FOR X-Axis Labels
    [lineGraph drawWallGraph];
    [self.view addSubview:lineGraph];


Result:


------------------------------------------------------------------------------------------------------------------------------------------------

If you give which column specifically you want to draw,give value of valueColumnsinRange  as [NSArray arrayWithObjects:@"1",@"3", nil] will have array of all valid columns you want to draw , It will plot those the columns on the Line graph.


      [MIMColor InitColors];

    NSString *csvPath = [[[NSBundle mainBundle] resourcePath] stringByAppendingPathComponent:@"myTable2.csv"];
    LineGraph *lineGraph=[[LineGraph alloc]initWithFrame:CGRectMake(50, 40, 600, 400)];
    lineGraph.needStyleSetter=YES;
    lineGraph.xIsString=YES; 
    lineGraph.anchorType=DEFAULT;  //OTHER anchorType
    [lineGraph readFromCSV:csvPath valueColumnsinRange:[NSArray arrayWithObjects:@"1",@"3", nil]];
    [lineGraph displayYAxis];
    [lineGraph displayXAxisWithStyle:3]; //OTHER styles FOR X-Axis Labels
    [lineGraph drawWallGraph];
    
    [self.view addSubview:lineGraph];


-------------------------------------------------------------------------------------------------------------------------------------------------------
If you have data sheet with x and y int values only as shown in this sheet. You want to plot x Vs. y, x Vs. y1 and x Vs. y2.


You can use following code. You give array of columns for x-axis separately and array of columns for y-axis values separately. Its important to have same number of elements in array for x-axis and y-axis.

      [MIMColor InitColors];
    NSString *csvPath2 = [[[NSBundle mainBundle] resourcePath] stringByAppendingPathComponent:@"myTableLinesWithIntOnly.csv"];
    
    LineGraph *lineGraph=[[LineGraph alloc]initWithFrame:CGRectMake(50, 40, 600, 400)];
    lineGraph.needStyleSetter=YES; 
    lineGraph.xIsString=NO; 
    lineGraph.anchorType=SQUAREFILLED;  //OTHER anchorType
    [lineGraph readFromCSV:csvPath2 xInColumn:[NSArray arrayWithObjects:@"0",@"0",@"0", nil] yInColumn:[NSArray arrayWithObjects:@"1",@"2",@"3", nil]];
    [lineGraph displayYAxis];
    [lineGraph displayXAxisWithStyle:3]; //OTHER styles FOR X-Axis Labels
    [lineGraph drawWallGraph];
    [self.view addSubview:lineGraph];


-------------------------------------------------------------------------------------------------------------------------------------------------
If you have data sheet of following type where you want to plot Month Vs. Income and Month Vs. Expense on the same line graph.


Following code will give you output as shown in the screenshot below.

      [MIMColor InitColors];
    NSString *csvPath1 = [[[NSBundle mainBundle] resourcePath] stringByAppendingPathComponent:@"myTableBar.csv"];    
    LineGraph *lineGraph=[[LineGraph alloc]initWithFrame:CGRectMake(50, 40, 600, 400)];
    lineGraph.needStyleSetter=YES;
    lineGraph.xIsString=YES; 
    lineGraph.anchorType=CIRCLEBORDER;  //OTHER anchorType
    [lineGraph readFromCSV:csvPath1 titleAtColumn:0 valueInColumn:[NSArray arrayWithObjects:@"4",@"8", nil]];
    [lineGraph displayYAxis];
    [lineGraph displayXAxisWithStyle:3]; //OTHER styles FOR X-Axis Labels
    [lineGraph drawWallGraph];
    
    [self.view addSubview:lineGraph];

Resulting output view


-----------------------------------------------------------------------------------------------------------------------------------------------
More details about the code used above in XCode project> HowToUseFiles > TestLineClass.m :


       /*
     
     Line Graph supports array of plain colors only.
     Gradient colors are not supported yet.
     
     */
    [MIMColor InitColors];
    
    
    /*These are 3 different types of data files which can be read by MIM Lib to create Line Graph*/
    NSString *csvPath = [[[NSBundle mainBundle] resourcePath] stringByAppendingPathComponent:@"myTable2.csv"];
    NSString *csvPath1 = [[[NSBundle mainBundle] resourcePath] stringByAppendingPathComponent:@"myTableBar.csv"];
    NSString *csvPath2 = [[[NSBundle mainBundle] resourcePath] stringByAppendingPathComponent:@"myTableLinesWithIntOnly.csv"];
    
    LineGraph *lineGraph=[[LineGraph alloc]initWithFrame:CGRectMake(50, 40, 600, 400)];
    
    
    /*
     
     If YES this will display the style setting button. Keep clicking on Next button to view next color pattern.
     Once you like a particular color combination,
     you can feed that number to lineGraph.style in next line of code and set needStyleSetter NO for release version
     It is provided only to help developer get better visualization of his chart in real time development
     */
    
    lineGraph.needStyleSetter=YES;
    
     /* 
     This is basically the INDEX of color object in your COLOR ARRAY
     THis is the color of lines which will be displayed on the line graph
    It can be any index number of your array.Note it goes in the loop.
     */
    lineGraph.style=10; 


    //NO only for third kind of data file(csvPath2) otherwise YES
    //lineGraph.xIsString=YES; 
    lineGraph.xIsString=NO; 


    /*
     
     SQUAREFILLED,
     SQUAREBORDER,
     CIRCLEFILLED,
     CIRCLEBORDER,
     DEFAULT,
     NONE.
     
     If you don't define it, By default it will be CIRCLEBORDER
     
     */
    lineGraph.anchorType=NONE;
    

    //case 1.1:
    //[lineGraph readFromCSV:csvPath valueColumnsinRange:nil];
    
    //case 1.2:
    //[lineGraph readFromCSV:csvPath valueColumnsinRange:[NSArray arrayWithObjects:@"1",@"3", nil]];
    
    
    //case 2:
    //[lineGraph readFromCSV:csvPath1 titleAtColumn:0 valueInColumn:[NSArray arrayWithObjects:@"4",@"8", nil]];
    
    
    //case 3:
    //Note [xInColumn array count]= [yInColumn array count], As the MIM Chart Lib maps x and y values in them.
    [lineGraph readFromCSV:csvPath2 xInColumn:[NSArray arrayWithObjects:@"0",@"0",@"0", nil] yInColumn:[NSArray arrayWithObjects:@"1",@"2",@"3", nil]];


    //If you want to display the values on x axis.
    [lineGraph displayYAxis];
    
    /* 3 styles exist for x-axis labels (1,2 and 3)*/
    /*If you don't want to display labels on x-axis, comment this line*/
    /*To find out what different styles looks like refer to following post: */
    [lineGraph displayXAxisWithStyle:3];
    
    
    //Finally draw them
    [lineGraph drawWallGraph];
    
    [self.view addSubview:lineGraph];


Entire Guide can be found HERE along with downloadables.

Monday, August 15, 2011

Bar Chart added

For now a simple bar chart has been added. We are working on introducing a lot more style to the bar charts.


You can find the code of MIM-Chart Library at the end of THIS POST.

5 styles of Anchor Point supported now.

In the last POST, we announced the addition of Linegraph. It is a wonderful tool always useful in displaying the maximum information in the most simplest way. If style is NONE, it displays simple lines with no Anchors, but 5 styles are available now.

As mentioned in the POST about adding more styles of Anchor Point. We have successfully added it now in our lib.


SQUAREFILLED


SQUAREBORDER


CIRCLEFILLED


CIRCLEBORDER


DEFAULT


You can find the code of MIM-Chart Library at the end of THIS POST.

Line Graph Added

Another feature (Line graph) has been added.
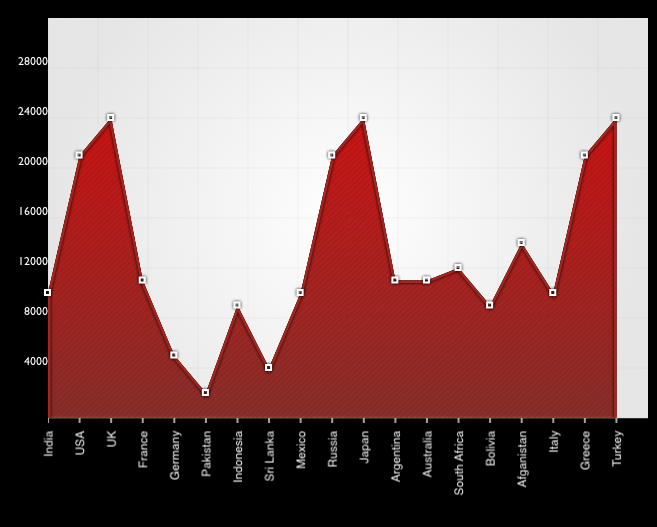
Currently it supports only simple Line graph. And it looks like following


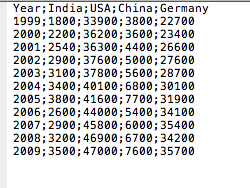
And our .csv file looks like following: (The data  is GDP of different countries of years 1999-2009)


You can find the code of MIM-Chart Library at the end of THIS POST.

Styles for Labeling on X-Axis

Labeling of X-Axis is available in 3 styles in MIM-Chart Library.

In TestWallClass.m, having _xBand.style=1; will give you following style on X-Axis.


Having _xBand.style=2; will give you following style on X-Axis.


Our csv file looks like following for style 1 and 2.


Having _xBand.style=3; will give you following style on X-Axis.


Our csv file looks like following for style 3.


You can find the code of MIM-Chart Library at the end of THIS POST.