Monday, August 29, 2011

MIMChart Library Update 1.1


Here is a complete GUIDE of all classes, it is still under construction but its detailed. LINK


So kindly  fetch the new and updated version from GitHub/Dropbox.

Link to Download ON GITHUB


Created a READ ME, to make it clear how to make use of it.


------------------------------------------------------------------------------------


This is a project (Opensource library)of chart libraries which can used in iPhone/iPads.
Charts available:
1.Line Graph
2.Wall Graph
3.Bar Graph
4.Fragmented Bar Graph
5.Pie Chart
6.Fragmented Pie Chart
7.Cluster Chart


Complete Guide can be found HERE


--------------------------------------------------------------
HOW TO USE IT IN YOUR CODE
--------------------------------------------------------------
1. Add 2 frameworks for sure (QuartzCore and CoreText)
2. Copy and Paste "Lib Files" folder in your project and Also add them to your project by right clicking your project in XCode and choose "Add files to your project". Note "Lib Files" folder can be found under MIMChartLib > "Lib Files" in MIMChart Project.

3. Add the .csv file (Data file) to the project as well from which you will be reading the data. Check the sample codes to find out about csv data files OR go to GUIDE link provided above.

4. Then you can add the chart of your purpose to your view in your app.

To find out more about how to stick the chart in your view please see the sample codes.
--------------------------------------------------------------
HOW TO RUN THE SAMPLE CODES IN THE LIBRARY.
--------------------------------------------------------------
1. Go to MIMChartLibAppDelegate.m in MIMChartLib folder in XCode.

2. You will see various rootControllers. You can comment/uncomment one by one  and RUN the code to see what they look like.
You can go to those Test Classes like TestClass,TestClassFragmented etc available in HowToUseFiles folder to get more idea.

--------------------------------------------------------------
AND you can find more info on HERE

MIM Chart Library version Alpha 1.0 Released !


Finally, its uploaded on GitHub.
You can find all related sample code, sample visuals and documentation HERE 

Complete Guide for Pie Chart and Fragmented Pie Chart (MIM Chart Lib)

So our data looks like following and we will make pie chart of the Income column.
Code is in XCode proj > HowToUseFiles> TestClass.m

     [MIMColor InitColors];

    NSString *csvPath = [[[NSBundle mainBundle] resourcePath] stringByAppendingPathComponent:@"myTable.csv"];
    MIMPieChart *pieChartView=[[MIMPieChart alloc]initWithFrame:CGRectMake(40, 40, 600, 500)];
    pieChartView.radius=200;
    pieChartView.tint=BEIGETINT;// Available Tints: GREENTINT,REDTINT,BEIGETINT
    [pieChartView readFromCSV:csvPath  TitleAtColumn:0  DataAtColumn:4];
    [pieChartView drawPieChart];
    [self.view addSubview:pieChartView];


It will make the pie chart look like following, you can change the tint color to see what they look like OR you can GO TO THIS POST to see them. If you tap on a region of pie chart, the respective information label gets highlighted, as in this case Indonesia is highlighted.


Now lets look at fragmented piechart , for now we can give data only through arrays, I need to add support for csv format. But you can use it as following as in XCode proj > HowToUseFiles> TestClassFragmented.m


      [MIMColor InitColors];
    
    _DFragmentedDoughNut *detailedDoughNut=[[_DFragmentedDoughNut alloc]initWithFrame:CGRectMake(0, 0, 600, 600)];
    detailedDoughNut.tint=GREENTINT;// Available Tints: GREENTINT,REDTINT,BEIGETINT
    detailedDoughNut.isShadow=YES;
    [detailedDoughNut setValuesArray:[NSArray arrayWithObjects:@"23",@"45",@"89",@"123",@"21",@"144", nil]];
    [detailedDoughNut setTitleArray:[NSArray arrayWithObjects:@"U.P.",@"Bihar",@"Delhi",@"Punjab",@"Haryana",@"Rajasthan", nil]];
    [detailedDoughNut setOutRadius:200 AndInnerRadius:300];
    [self.view addSubview:detailedDoughNut];
    
Output looks like following


Entire Guide can be found HERE along with downloadables.

Complete Guide for Wall Graph (MIM Chart Lib)

Following is our data and we want to plot Months Vs. Income

Our code residing in XCode Project > HowToUseFiles > WallTestClass.m

      [MIMColor InitFragmentedBarColors];
    
    
    NSString *csvPath = [[[NSBundle mainBundle] resourcePath] stringByAppendingPathComponent:@"myTable1.csv"];
    WallGraph *wallGraph=[[WallGraph alloc]initWithFrame:CGRectMake(50, 40, 600, 400)];
    wallGraph.xIsString=YES;//For Now only xIsString=YES is supported.
    wallGraph.isGradient=YES;
    wallGraph.isShadow=YES;
    wallGraph.style=14;
    wallGraph.needStyleSetter=YES;
    wallGraph.anchorType=NONE;
    [wallGraph readFromCSV:csvPath  TitleAtColumn:0  DataAtColumn:4];
    [wallGraph displayYAxis];
    [wallGraph drawWallGraph];
    [self.view addSubview:wallGraph];
    

So our result looks like following


--------------------------------------------------------------------------------------------------------------------------------------------
The setting as shown in the code below will give result as shown in screenshot just below the code

       wallGraph.isGradient=YES;
    wallGraph.isShadow=NO;
    wallGraph.style=14;
    wallGraph.needStyleSetter=YES;
    wallGraph.anchorType=CIRCLEBORDER;


--------------------------------------------------------------------------------------------------------------------------------------------
Tapping on the Anchor points, will display the corresponding data of the point.

       wallGraph.isGradient=YES;
    wallGraph.isShadow=YES;
    wallGraph.style=14;
    wallGraph.needStyleSetter=YES;
    wallGraph.anchorType=CIRCLEBORDER;


--------------------------------------------------------------------------------------------------------------------------------------------

       wallGraph.isGradient=YES;
    //wallGraph.isShadow=YES;
    //wallGraph.style=14;
    wallGraph.needStyleSetter=YES;
    wallGraph.anchorType=CIRCLEFILLED;


--------------------------------------------------------------------------------------------------------------------------------------------

       wallGraph.isGradient=YES;
    //wallGraph.isShadow=YES;
    //wallGraph.style=14;
    wallGraph.needStyleSetter=YES;
    wallGraph.anchorType=NONE;DE


--------------------------------------------------------------------------------------------------------------------------------------------

       wallGraph.isGradient=YES;
    //wallGraph.isShadow=YES;
    //wallGraph.style=14;
    wallGraph.needStyleSetter=YES;
    wallGraph.anchorType=DEFAULT;


--------------------------------------------------------------------------------------------------------------------------------------------
NOTE: wallGraph.needStyleSetter=NO; For remove the NEXT button on the screen.


Entire Guide can be found HERE along with downloadables.

Complete Guide for Line Chart Chart (MIM Chart Lib)

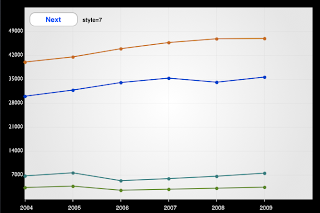
So our data sheet looks like following screenshot which I want to plot using MIM Chart lib - Line Graph. We want to plot Per Capita Income of India, USA, China, Germany yearwise.


If you don't give which column specifically you want to draw,give value of valueColumnsinRange  as nil , It will plot all the columns on the Line graph.

      [MIMColor InitColors];
    NSString *csvPath = [[[NSBundle mainBundle] resourcePath] stringByAppendingPathComponent:@"myTable2.csv"];

    LineGraph *lineGraph=[[LineGraph alloc]initWithFrame:CGRectMake(50, 40, 600, 400)];
    lineGraph.needStyleSetter=YES;
    lineGraph.xIsString=YES
    lineGraph.anchorType=CIRCLEFILLED; //VIEW OTHER anchorType
    [lineGraph readFromCSV:csvPath valueColumnsinRange:nil]; 
    [lineGraph displayYAxis];
    [lineGraph displayXAxisWithStyle:3]; //VIEW OTHER styles FOR X-Axis Labels
    [lineGraph drawWallGraph];
    [self.view addSubview:lineGraph];


Result:


------------------------------------------------------------------------------------------------------------------------------------------------

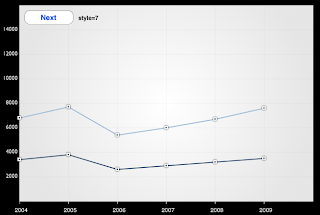
If you give which column specifically you want to draw,give value of valueColumnsinRange  as [NSArray arrayWithObjects:@"1",@"3", nilwill have array of all valid columns you want to draw , It will plot those the columns on the Line graph.


      [MIMColor InitColors];

    NSString *csvPath = [[[NSBundle mainBundle] resourcePath] stringByAppendingPathComponent:@"myTable2.csv"];
    LineGraph *lineGraph=[[LineGraph alloc]initWithFrame:CGRectMake(50, 40, 600, 400)];
    lineGraph.needStyleSetter=YES;
    lineGraph.xIsString=YES
    lineGraph.anchorType=DEFAULT //OTHER anchorType
    [lineGraph readFromCSV:csvPath valueColumnsinRange:[NSArray arrayWithObjects:@"1",@"3", nil]];
    [lineGraph displayYAxis];
    [lineGraph displayXAxisWithStyle:3]; //OTHER styles FOR X-Axis Labels
    [lineGraph drawWallGraph];
    
    [self.view addSubview:lineGraph];


-------------------------------------------------------------------------------------------------------------------------------------------------------
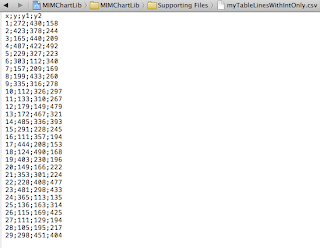
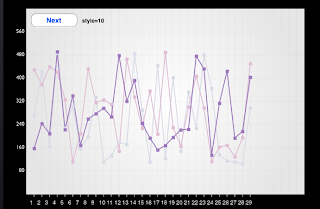
If you have data sheet with x and y int values only as shown in this sheet. You want to plot x Vs. y, x Vs. y1 and x Vs. y2.


You can use following code. You give array of columns for x-axis separately and array of columns for y-axis values separately. Its important to have same number of elements in array for x-axis and y-axis.

      [MIMColor InitColors];
    NSString *csvPath2 = [[[NSBundle mainBundle] resourcePath] stringByAppendingPathComponent:@"myTableLinesWithIntOnly.csv"];
    
    LineGraph *lineGraph=[[LineGraph alloc]initWithFrame:CGRectMake(50, 40, 600, 400)];
    lineGraph.needStyleSetter=YES
    lineGraph.xIsString=NO
    lineGraph.anchorType=SQUAREFILLED //OTHER anchorType
    [lineGraph readFromCSV:csvPath2 xInColumn:[NSArray arrayWithObjects:@"0",@"0",@"0", nil] yInColumn:[NSArray arrayWithObjects:@"1",@"2",@"3", nil]];
    [lineGraph displayYAxis];
    [lineGraph displayXAxisWithStyle:3]; //OTHER styles FOR X-Axis Labels
    [lineGraph drawWallGraph];
    [self.view addSubview:lineGraph];


-------------------------------------------------------------------------------------------------------------------------------------------------
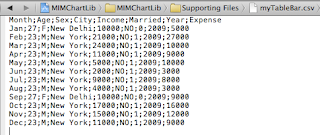
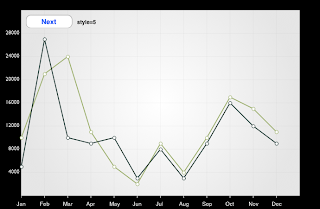
If you have data sheet of following type where you want to plot Month Vs. Income and Month Vs. Expense on the same line graph.


Following code will give you output as shown in the screenshot below.

      [MIMColor InitColors];
    NSString *csvPath1 = [[[NSBundle mainBundle] resourcePath] stringByAppendingPathComponent:@"myTableBar.csv"];    
    LineGraph *lineGraph=[[LineGraph alloc]initWithFrame:CGRectMake(50, 40, 600, 400)];
    lineGraph.needStyleSetter=YES;
    lineGraph.xIsString=YES
    lineGraph.anchorType=CIRCLEBORDER //OTHER anchorType
    [lineGraph readFromCSV:csvPath1 titleAtColumn:0 valueInColumn:[NSArray arrayWithObjects:@"4",@"8", nil]];
    [lineGraph displayYAxis];
    [lineGraph displayXAxisWithStyle:3]; //OTHER styles FOR X-Axis Labels
    [lineGraph drawWallGraph];
    
    [self.view addSubview:lineGraph];

Resulting output view


-----------------------------------------------------------------------------------------------------------------------------------------------
More details about the code used above in XCode project> HowToUseFiles > TestLineClass.m :


       /*
     
     Line Graph supports array of plain colors only.
     Gradient colors are not supported yet.
     
     */
    [MIMColor InitColors];
    
    
    /*These are 3 different types of data files which can be read by MIM Lib to create Line Graph*/
    NSString *csvPath = [[[NSBundle mainBundle] resourcePath] stringByAppendingPathComponent:@"myTable2.csv"];
    NSString *csvPath1 = [[[NSBundle mainBundle] resourcePath] stringByAppendingPathComponent:@"myTableBar.csv"];
    NSString *csvPath2 = [[[NSBundle mainBundle] resourcePath] stringByAppendingPathComponent:@"myTableLinesWithIntOnly.csv"];
    
    LineGraph *lineGraph=[[LineGraph alloc]initWithFrame:CGRectMake(50, 40, 600, 400)];
    
    
    /*
     
     If YES this will display the style setting button. Keep clicking on Next button to view next color pattern.
     Once you like a particular color combination,
     you can feed that number to lineGraph.style in next line of code and set needStyleSetter NO for release version
     It is provided only to help developer get better visualization of his chart in real time development
     */
    
    lineGraph.needStyleSetter=YES;
    
     /* 
     This is basically the INDEX of color object in your COLOR ARRAY
     THis is the color of lines which will be displayed on the line graph
    It can be any index number of your array.Note it goes in the loop.
     */
    lineGraph.style=10; 


    //NO only for third kind of data file(csvPath2) otherwise YES
    //lineGraph.xIsString=YES; 
    lineGraph.xIsString=NO


    /*
     
     SQUAREFILLED,
     SQUAREBORDER,
     CIRCLEFILLED,
     CIRCLEBORDER,
     DEFAULT,
     NONE.
     
     If you don't define it, By default it will be CIRCLEBORDER
     
     */
    lineGraph.anchorType=NONE;
    

    //case 1.1:
    //[lineGraph readFromCSV:csvPath valueColumnsinRange:nil];
    
    //case 1.2:
    //[lineGraph readFromCSV:csvPath valueColumnsinRange:[NSArray arrayWithObjects:@"1",@"3", nil]];
    
    
    //case 2:
    //[lineGraph readFromCSV:csvPath1 titleAtColumn:0 valueInColumn:[NSArray arrayWithObjects:@"4",@"8", nil]];
    
    
    //case 3:
    //Note [xInColumn array count]= [yInColumn array count], As the MIM Chart Lib maps x and y values in them.
    [lineGraph readFromCSV:csvPath2 xInColumn:[NSArray arrayWithObjects:@"0",@"0",@"0", nil] yInColumn:[NSArray arrayWithObjects:@"1",@"2",@"3", nil]];


    //If you want to display the values on x axis.
    [lineGraph displayYAxis];
    
    /* 3 styles exist for x-axis labels (1,2 and 3)*/
    /*If you don't want to display labels on x-axis, comment this line*/
    /*To find out what different styles looks like refer to following post: */
    [lineGraph displayXAxisWithStyle:3];
    
    
    //Finally draw them
    [lineGraph drawWallGraph];
    
    [self.view addSubview:lineGraph];


Entire Guide can be found HERE along with downloadables.

Saturday, August 27, 2011

Complete Guide for Bar Chart (MIM Chart Lib)

Following is the sample code and all information required to create a Bar Chart.
I have added a style setter button for letting developers adjust the colors of Chart in real time development.  Bar Chart is ready for release in MIM Chart Lib version Alpha  1.0

You can find this sample code in MIMChartLib> HowToUseFiles >BarTestClass.m with MIM Chart  Lib.


        /*
     
     Init color array.
     You can create your own color array in MIMColor.m
    
     */
    
    [MIMColor nonAdjacentGradient];


    NSString *csvPath = [[[NSBundle mainBundle] resourcePath] stringByAppendingPathComponent:@"myTableBar.csv"];
    BarChart *barGraph=[[BarChart alloc]initWithFrame:CGRectMake(50, 40, 700, 400)];
    
    
    /*
     
     isGradient =YES if color array has gradient colors
     isGradient = NO if color array has plain colors.
     */
    
    barGraph.isGradient=NO;
    
    
    /* 
     This is basically the INDEX of color object in your COLOR ARRAY
     THis is the color which will be displayed on the bar chart
     It can be ANY number if isGradient=NO. 
     Should be an EVEN number if isGradient=YES. 
     */
    //barGraph.style=10; 


    /*
     It value is YES if values displayes on X-axis are strings..like in our case Jan, Feb i.e Names of the months
     MIM Chart Lib "Currently supports only string values" for X-axis for Bar Charts. so keep it YES.
     */
    barGraph.xIsString=YES


    /*
     
     If YES this will display the style setting button. Keep clicking on Next button to view next color pattern.
     Once you like a particular color combination,
     you can feed that number to fbarChartView.style and set needStyleSetter NO for release version
     It is provided only to help developer get better visualization of his chart in real time development
     */
    
    barGraph.needStyleSetter=YES;
    
    
    barGraph.groupBars=NO;
    
    
    /*
     
     You can define your own barWidth, 
     if not defined, MIM Chart lib finds out appropriate width automatically.
     If you are not sure, how much barwidth will fit into your screen, comment it like I did.
     
     */
    barGraph.barWidth=40;


    /*
     
     Giving the columns from where MIM Chart lib will get the values of X and Y axis is important
     In this case, X-axis values are coming from 0th column
     and Y-axis values are coming from 4th column
     
     Columns indexing is like 0,1,2,3,4,5,6... note: it starts from 0.
     */
    
    [barGraph readFromCSV:csvPath  TitleAtColumn:0  DataAtColumn:4];
    
    /*If you don't want to display labels on y-axis, comment this line*/
    [barGraph displayYAxis]; 
    
    
    /* 3 styles exist for x-axis labels (1,2 and 3)*/
    /*If you don't want to display labels on x-axis, comment this line*/

    /*To find out what different styles looks like refer to following post: */
    [barGraph displayXAxisWithStyle:3];
    
    /*Finally draw All*/
    [barGraph drawBarGraph];
    
    
    [self.view addSubview:barGraph];


You can change the color of bars with NEXT button, and set barGraph.style to the number displaying in front of style on screen. And to remove NEXT button,  barGraph.needStyleSetter=NO;
Its that simple !
Bar Chart with gradient

Bar Chart without gradient


Entire Guide can be found HERE along with downloadables.


Friday, August 26, 2011

Complete Guide for FragmentedBar Chart (MIM Chart Lib)

Following is the sample code and all information required to create a Fragmentedbar Chart.
I have added a style setter button for letting developers adjust the colors of Chart in real time development.  FragmentedBar Chart is ready for release in MIM Chart Lib version Alpha  1.0

You can find this sample code in MIMChartLib> HowToUseFiles >FragmentedBarTestClass.m with MIM Chart  Lib.

       /*Important here in the beginning*/
    /*This will init the Color Array*/
    
    [MIMColor InitFragmentedBarColors];


    /*
   
     isGradient is one of the property of FragmentedBarChart
     if fbarChartView.isGradient=YES; User any of following 2 methods to init the gradient colors
     +(void)InitFragmentedBarColors
     +(void)nonAdjacentGradient
     
     
     if fbarChartView.isGradient=NO; User give method to init the plain colors
     +(void)nonAdjacentPlainColors
     
     
     Note: You can write your own colors method in MIMColor.m 
     and define your own colors.
     
     */


     /* Note: You can have your own frame size as per your need. */
    
    NSString *csvPath = [[[NSBundle mainBundle] resourcePath] stringByAppendingPathComponent:@"myTableFragmentedBar.csv"];
    FragmentedBarChart *fbarChartView=[[FragmentedBarChart alloc]initWithFrame:CGRectMake(80, 40, 600, 400)];
    
    //Has to be any even number,Please put 0 if no clue. Or you can prefer to skip writing it as well like I have commented it.
    //fbarChartView.style=48;
    
    /*if yes this will display the style setting button.Keep clicking on Next button to view next color pattern. Once you like a particular color combination,
     you can feed that style number to fbarChartView.style and set needStyleSetter NO for release version*/
    /*It is provided only to help developer get better visualization of his chart in real time development*/
    fbarChartView.needStyleSetter=YES;


    /*Is set to YES if you will see gradient in fragments and make sure your colorarray has gradient colors*/
    /*If you dont define it, it is by default NO*/
    fbarChartView.isGradient=YES;
    
    /*If you want, you can define the width of bar yourself.If not defined, it will auto-calculate and fit on the screen*/
    fbarChartView.barWidth=40;
    
    /*Here on, all important lines, need to be written*/
    /*Method below displayXAxisWithTitleFromColumn:Style:   , here style == 3*/
    /*More style available (style=1,2 or 3) you can refer given post to see what styles look like*/
    
    fbarChartView.xIsString=YES;
    [fbarChartView readTitlesFromCSV:csvPath];
    [fbarChartView drawFragmentedBarGraph];
    [fbarChartView displayYAxis];
    [fbarChartView displayXAxisWithTitleFromColumn:-1 Style:3];
    [self.view addSubview:fbarChartView];


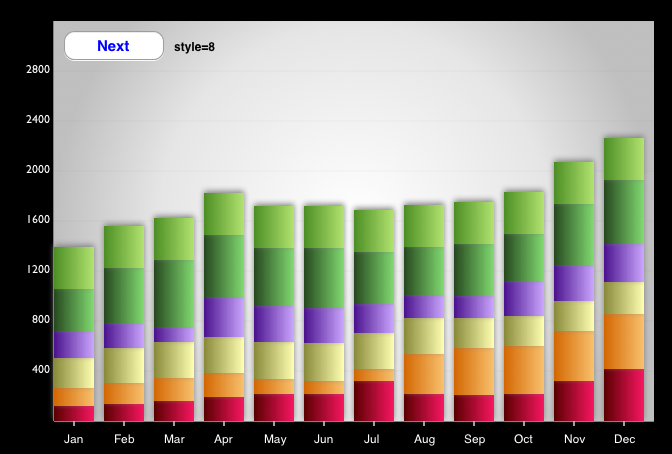
Following is what screen looks like with setting button visible. You can remove it by setting fbarChartView.needStyleSetter=NO;

Or Simple just don't write this line at all. It takes fbarChartView.needStyleSetter by default as NO.


What you can do with Next button and style value. Please read the comments in the code above.


I have set  barwidth to 40 by using fbarChartView.barWidth=40;
My Chart looks like following 


.


All the above screenshots are with gradients, let see if we use No gradient our screenshot looks like following. Please read comments in code above to know about how to turn On/Off the gradient.


Our data csv file looks like following. Kindly note the location of the file in project as well.


Entire Guide can be found HERE along with downloadables.